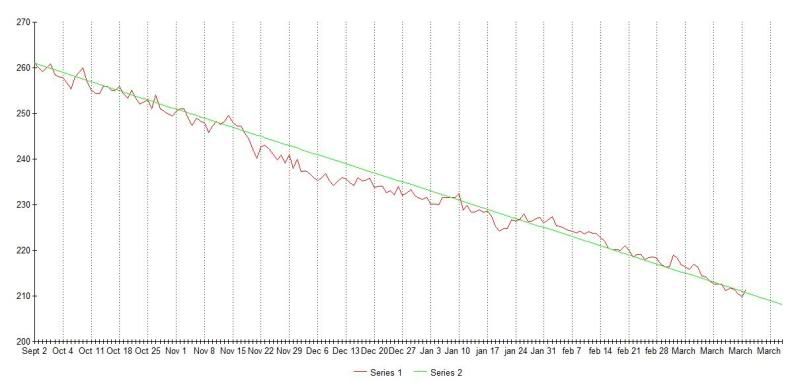
I keep track of my weight in a spreadsheet on my computer, so it's fairly easy to graph it and see just how non-linear weight loss is. This chart is over the last six months, so it's getting less rigid looking the longer time passes.


 It's pretty dang inspirational! Thanks for the tips!