Just something I whipped up in Excell this morning. I think it's kinda nifty. I'm both a numbers freak and I'm visual, so this really helps me.
That little blip near the end was crazy. I lost like 3lbs in a week, then regained some back which was depressing. But on the graph, it's just a blip, and I'm continuing with my regular progress, lol. No idea what caused it.
oooohhhh, pretty graph. I am an excel/numbers freak too and the visual is a definite boost when I'm feeling sluggish. Congrats on your progress, you're soooo close to your goal. Keep up the great work!
Thanks guys I was procrastinating from a lab report in Excel...this was much more fun, haha.
It is very motivational, and it also puts things in perspective. Last week and this weekend, my weight was all over the place. Losing 3lbs last week, then jumping up a pound, then nothing for a few days, and now losing again. It was confusing and startling after previously fairly steady loss. But the graph it just looks like a little anomalie.
My best friend is great at Excel and she made a graph like this for our weight loss (we are doing a friendly competition to see who can lose the most by Memorial Day). It's awesome to see it going down, except for a slight gain when we went on vacation.
You're doing so great, I'm using your timeline to see if I'm on track for losing as much as you as quickly and I am! Yay!
Megan, you're doing really well. You're approaching maintenance, and your weight loss is slowing down. That's what you should expect. Even if you don't see much change on the scale in the next weeks (or months), you'll still adjusting and probably exchanging muscle for fat.
I am definitely a numbers/visual person as well. As such i have a pretty complicated excel sheet that does fun stuff like average daily weight loss. Then it takes that number and projects what days i will hit my goals. Fun stuff.
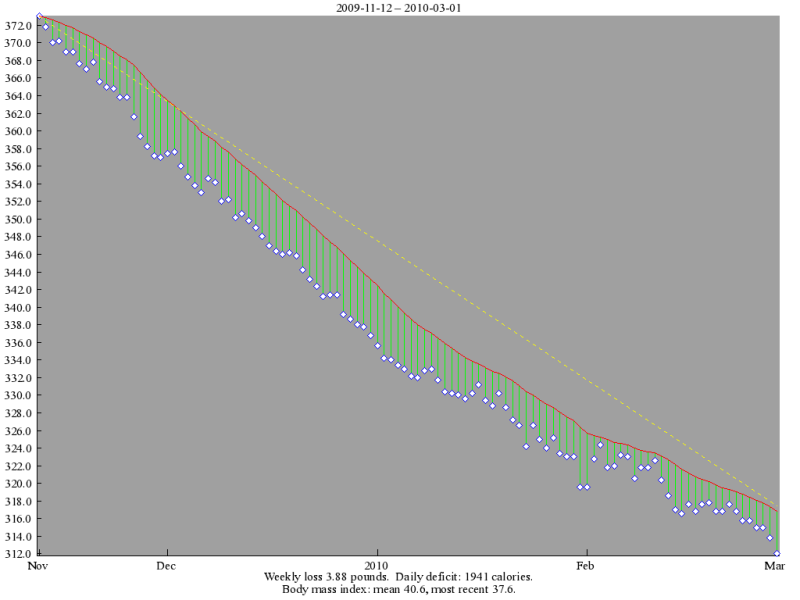
But for a graph i use hacker's diet which does neat graphing. This is my graph from them at the moment.
The white dots are my actual weight the yellow line is the rate of weightloss needed to half my max weight in a year.
I've done this, too. I track my weight daily in Excel, and have a daily graph plus an overall monthly graph. I love the daily graphs. When I go back and look at all of them, I had gains and losses on a continual basis. But if I end up at a lower weight at the end of the month than I started out with, I consider it a good month.
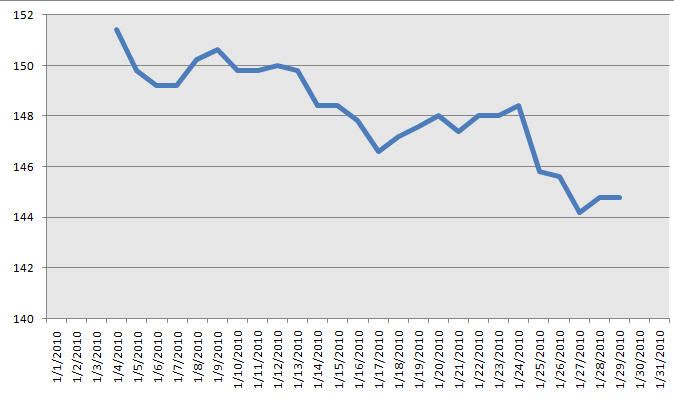
Here is one from January in which I went from 151 to 144.8
Here's mine too. As you can see for the last couple of weeks I've been gaining and loosing the same 2 lbs. I just want to see them gone for good. I'm so sick of "Woohoo I've lost weight.... Oh sh!t no I haven't" - Cycle. Graph.jpg
You'll haveta click on the tumbnail. Unless someone can tell me how to make it bigger!
Megan, Congrats on the success!!! That is really wonderful! I was wondering...what type of plan have you been following? Calorie counting etc...I would love to know!
Leonea84, I honestly can't say I have really followed a strict plan. I suppose I would fall under a calorie counter, since that is mostly what I do. But I'm not at all exact. Nor do I record or journal or plan. I just kind of add it up in my head throughout the day. I try to stay between 1300 and 1500 and cycle. I don't go below 1200 and I don't go above 1800. I also don't really pay attention to sodium and fat grams as much as I should. I just look at calories, and try to buy low/no sodium and low/fat free products.
I have recently added strength training, but up until last week, I wasn't doing any cardio at all. I have a fairly active job though.


 I was procrastinating from a lab report in Excel...this was much more fun, haha.