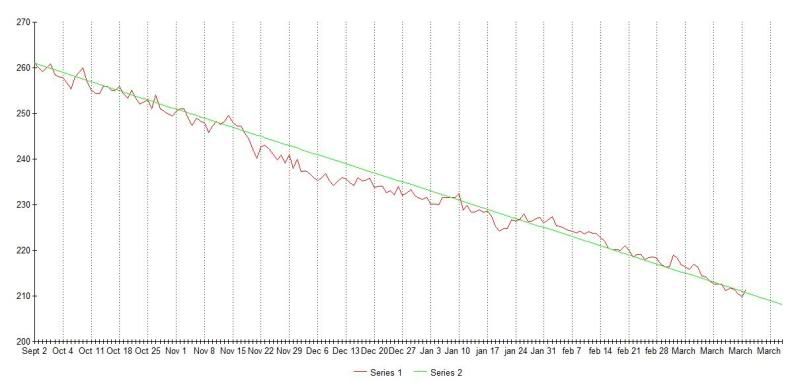
This is for every one who is tired of seeing the scale bounce up and down constantly: this is my weight chart, and you can see that even the biggest jumps turn out to be normal. I can also see that the weeks before I have my tom, I'm almost always stalled, then I drop quickly. It's a real relief to see it, and I would recommend to any of you to make one.
I keep track of my weight in a spreadsheet on my computer, so it's fairly easy to graph it and see just how non-linear weight loss is. This chart is over the last six months, so it's getting less rigid looking the longer time passes.
Thanks for sharing your graph. There is a free online weight graph you can try at fridgegraph dot com -- it is absolutely free, and lets you graph your loss quickly. I don't work there, and it isn't for sale, and I'm a junior member, so if this is inappropriate to do, then just delete this and let me know!!!
I'll try to keep up the same positive attitude that you have and I guess I need to go to the store to buy some PATIENCE!!!!
Kira
fourmilab.ch/hackdiet/online/hdo.html (can't post links)
They have a weight loss recording thing that does a moving average (say, the last four values averaged together). Seems pretty decent and doesn't require much effort.
Like you, I started recording my weight every day on a spreadsheet so that I could plot that onto a graph and see the general trend. I've found it really helps me not worry about any small gains and fluctuations, because you can see the overall pattern of the weight decreasing. I've been doing it for a month so it's not as dramatic as yours, but it looks really similar in the way that there are plenty of minor fluctuations!
I also found it helped me be honest about my weight. I used to never record a fluctuation up, and just record the lowest weight that I was at, as though I was pretending the number never increased on the scales. I don't do this anymore. Admitting to small gains by recording them on my chart has helped me not worry about fluctuations as I can really see now that it's a totally normal part of my weight loss, and I no longer feel so disheartened by it.
I'm glad this thread was bumped. I think people need to see this. It's so easy to get discouraged when the numbers on the scale don't drop every day. And despite the fact that the maintainers keep repeating the mantra that weight loss isn't linear, it's important for the folks who are just starting out (or experiencing their own bumpy ride or plateau) to see what that really looks like. Thanks Kelly!
I'm glad this thread was bumped. I think people need to see this. It's so easy to get discouraged when the numbers on the scale don't drop every day. And despite the fact that the maintainers keep repeating the mantra that weight loss isn't linear, it's important for the folks who are just starting out (or experiencing their own bumpy ride or plateau) to see what that really looks like. Thanks Kelly!
This was exactly me yesterday (frustrated) and then today, the scale dropped 5 lbs! I'm going to start my graph today! Thank you!!!!!
I keep a graph, too. Well, I'll admit to being a little bit quantitatively overboard, and I keep 3 graphs: One like Kelly's that show's the daily weights along with the 7-day moving average, one that shows just the weekly loss (ie, my weight every Monday), and one that shows just the monthly loss (ie, my weight on the 10th of every month.