Would love to have a look at other people's weight loss graphs (or exercise, or size or whatever it is that you plot really). I'm a scientist so i can relate to graphs! Really they tell a story that you may or may not want telling!!
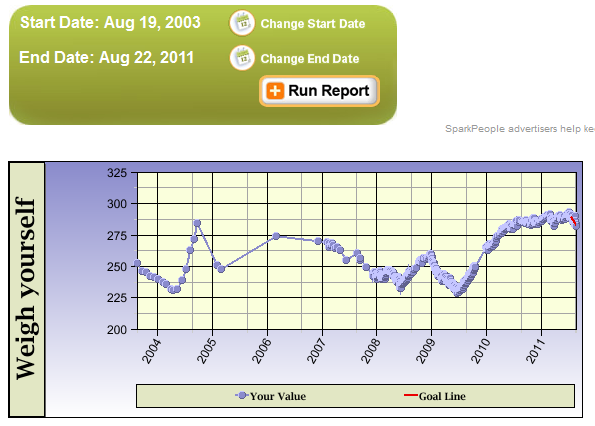
Mine looks awful, but i'll display it anyway. (And you might not see it as i think i've shrunk it to too low definition??) This is for the last two years and shows that my current effort looks like it's far too steep a line to be sustainable. Sigh.
It also shows that over time i'm pretty predictable in that i'll be good for a bit, and lose weight, then stop weighing myself, put on weight, repeat every 6 months, and it's really not clever.
If i went to my other computer i could probably drag up a graph for 5 or 6 years before this one that will show similar ups and downs in a similar range.
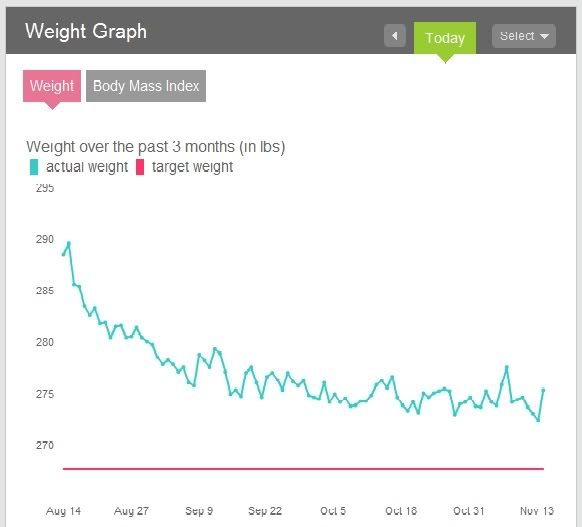
I didn't start tracking my weight with this app until July, hence the smooth line before that. To me it shows an incredibly slow downward trend (<1kg/month).
I love this idea - I posted a thread like this a couple of months ago. Hope you get more takers than I did.
Here's my current graph. It covers more than 27 months. What I love about it is how it shows so many different aspects of the process. It shows the long-term variances - I can see places where I lost my focus for a while due to other aspects of my life, but still managed to get back on the horse as soon as I could. I can see how the long-term rate of loss is directly correlated to how hard I am working. (The last 3 weeks, for example, show steeper loss than the previous 4 weeks, because I recommitted about 4 weeks ago and have been perfectly on plan that whole time.
But I can also see the short-term fluctuations that happen regardless of how hard I am working. It helps to see those too, to remember that no matter how big the short-term fluctuations feel when they are happening, they really mean very little in the grand scheme of my weight loss. It helps me keep my perspective and my patience.
June 2009 - after rapidly gaining weight over the previous 6-12 months, weight loss/exercise began "for real"
December 2009 - Holiday season - bumped right back up to nearly my start weight
2010 - a slow decline (but with nearly 6 months hovering around 140)
2011 - got really close to my "goal" but then bounced up, hovered around a decent maintenance weight of 135 and then..... where I am now, due to really bad habits creeping back in ... bounced up by at least 5 lbs again.
ARRRRRRRGH. So hard to lose 5-10 lbs. MORE THAN TWO YEARS of trying to lose less than 25 lbs.
My graph starts when I'm in high school and goes to present (so about 15 years!). I was able to maintain my weight throughout high school and college (with a jump in between). I had a mini-spike when I started grad school and then a major spike during my pregnancy. At first I lost weight post-pregnancy but quickly got into a gaining trend until I started this journey about 1.5 years ago. Hopefully there's going to be a downward trend for awhile still, followed by a long plateau (with a small blimp upward for a future pregnancy or two ).
Last edited by runningfromfat; 11-14-2011 at 12:29 PM.
Six month history and 12 week projected weight loss:
This has slowed down to a complete stop the past two weeks as I approach my goal -- and obviously I have no intention of reaching 96 pounds in February.
Six month RDA nutritional profile:
The only nutrient I can't seem to get enough of is Phosphorus. I am thinking about switching from a Calcium/magnesium/vitamin D supplement a phosphorus/calcium supplement. I have too much vitamin D anyway.
Caloric sources breakdown:
I am quite satisfied with this profile.
Last edited by shr1nk1ngme; 11-15-2011 at 12:56 AM.